Building Great Data Visualizations: A Case Study
Data visualizations are interactive and visual stories that have potential to powerfully engage audiences. These content pieces always start out in the same place: a spreadsheet filled with lots of numbers. How can you take data and do something meaningful with it?
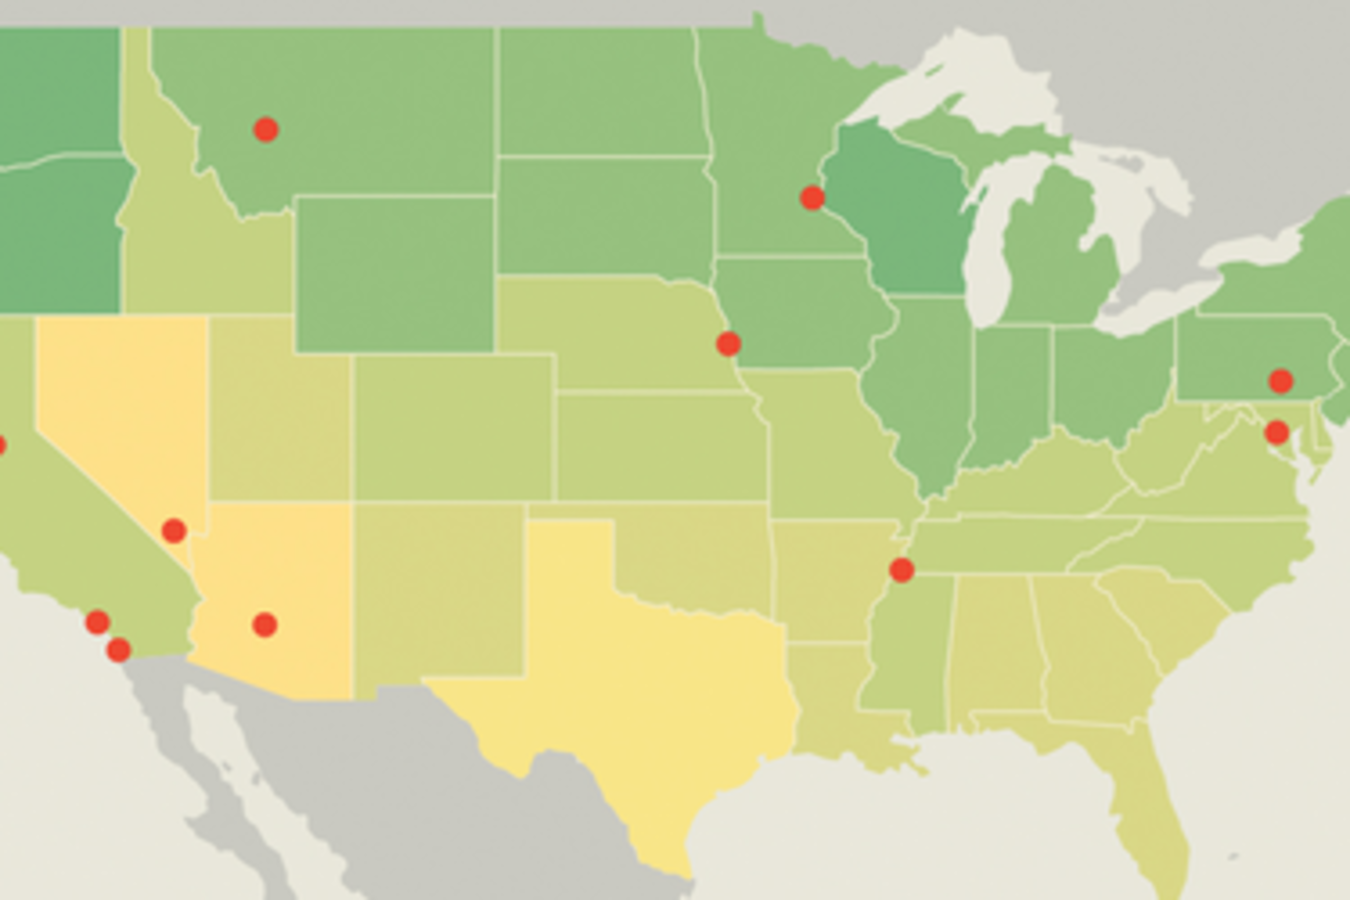
In four weeks, Climate Central and Radish Lab worked to take temperature data from 1,001 US cities and crunch it into a compelling, yet shockingly simple interactive that had more than a million views within three days of launch.
From story ideas, to crunching data, sketching concepts, design, development and roll-out, you’ll learn how to turn your data into shareable, engaging stories that get the traction you want.
Presenters

Alana Range
CEO, Creative Dir
Radish Lab
Alana is the founder, CEO, and Creative Director at Radish Lab, an interactive agency focused exclusively on social impact projects. An award-winning journalist turned digital media producer, story...
Show the rest
Brian Kahn
Sr Science Writer
Climate Central
Brian Kahn is a Senior Science Writer at Climate Central. He previously worked at the International Research Institute for Climate and Society and partnered with climate.gov to produce multimedia s...
Show the restDetails
Venue Info
View in Google MapsPeople also favorited

Thanks to our sponsors
