Visually Turning Complexity into Clarity
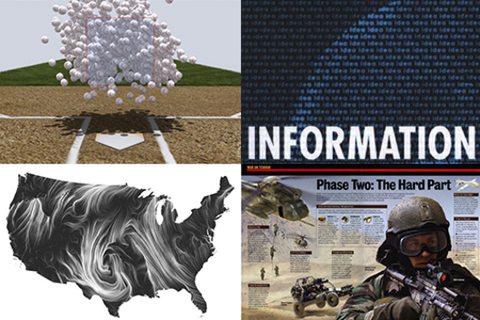
Dogbert says to Diibert: "Information is gushing toward your brain like a firehose aimed at a teacup!" An extremely effective way to make sense of all this information is to find stories in the data and visualize them, which can speed comprehension, summarize the complex, show hidden relationships, reveal patterns and more.
And this is happening across all industries, from scientific and medical groups —who often have to explain complex information to a lay audience— to PR firms and other businesses who are looking for ways to engage, inform and motivate their markets.
We are a unique gathering of professional visual communicators who employ a wide variety of storytelling platforms (print, interactive and motion graphics) and visual tools (maps, graphs, diagrams, video, etc.) to do our jobs. We will explain our process for finding visual stories in the data, discuss the best technologies for doing what we do and illustrate how we build, plan and execute graphics.
Presenters

Fernanda Viégas
Research Scientist
Fernanda Viégas is a computational designer whose work focuses on the social, collaborative, and artistic aspects of information visualization. She co-leads Google's "Big Picture" data visualization group with Martin Wattenberg. Her artistic visualizations have been exhibited in venues such as the New York Museum of Modern Art, the Boston Institute of Contemporary Art, and the Whitney Museum of American Art.

Graham Roberts
Graphics/Multimeda Editor
The New York Times
Graham Roberts is a Graphics/Multimedia Editor at The New York Times. He creates work for both print and digital editions, along with the diverse and talented NYT Graphics team.
Karl Gude
Graphics Editor in Residence
School of Journalism at Michigan State University
Karl Gude is the former Director of Information Graphics (infographics) at Newsweek magazine and The Associated Press. Karl left Newsweek in 2006 after ten years to create an information graphics and visual communication program at Michigan State University's School of Journalism where he is currently the Graphics Editor in Residence.
During Karl’s 26 years in News, he has made or overseen the creation of infographics on every topic imaginable: business/lifestyle/sports stories, countless technical, medical and scientific discoveries and breaking news.
Karl is a visual storyteller, artist and designer who aims his infographics lens at industries beyond journalism. He speaks globally on visualization and regularly consults with governmental agencies, including the CIA and the National Science Foundation. He was recently invited by scientists at CERN, Switzerland to work with students to create a planetarium show explaining the science of the Large Hadron Collider.

Ronnie Lipton
Info Design Author, Trainer, Consult
Author of three published books on visual communication, an information designer, and a content strategist, Ronnie focuses on the ideal mix of words, pictures, and presentation to tell clear stories that connect with the audience.
Thanks to our sponsors


Music sponsor